Dual-income households optimizing taxes and benefits
Dual-income households optimizing taxes and benefits · New CA residents
Planning, investing, and benefits explainers tuned for real West Coast paychecks and housing costs.

13.3%
CA top marginal income tax rate
$800K+
CA median home price (Zillow 2025)
SALT
Cap hits Californians hardest
Net Pay Estimator
Illustrative$18,243
Federal
$8,160
State
$9,180
FICA
30%
Eff. Rate
Illustrative estimate only — not tax advice. Uses simplified 2025 federal brackets and estimated state effective rates. Verify with a licensed CPA or tax professional.
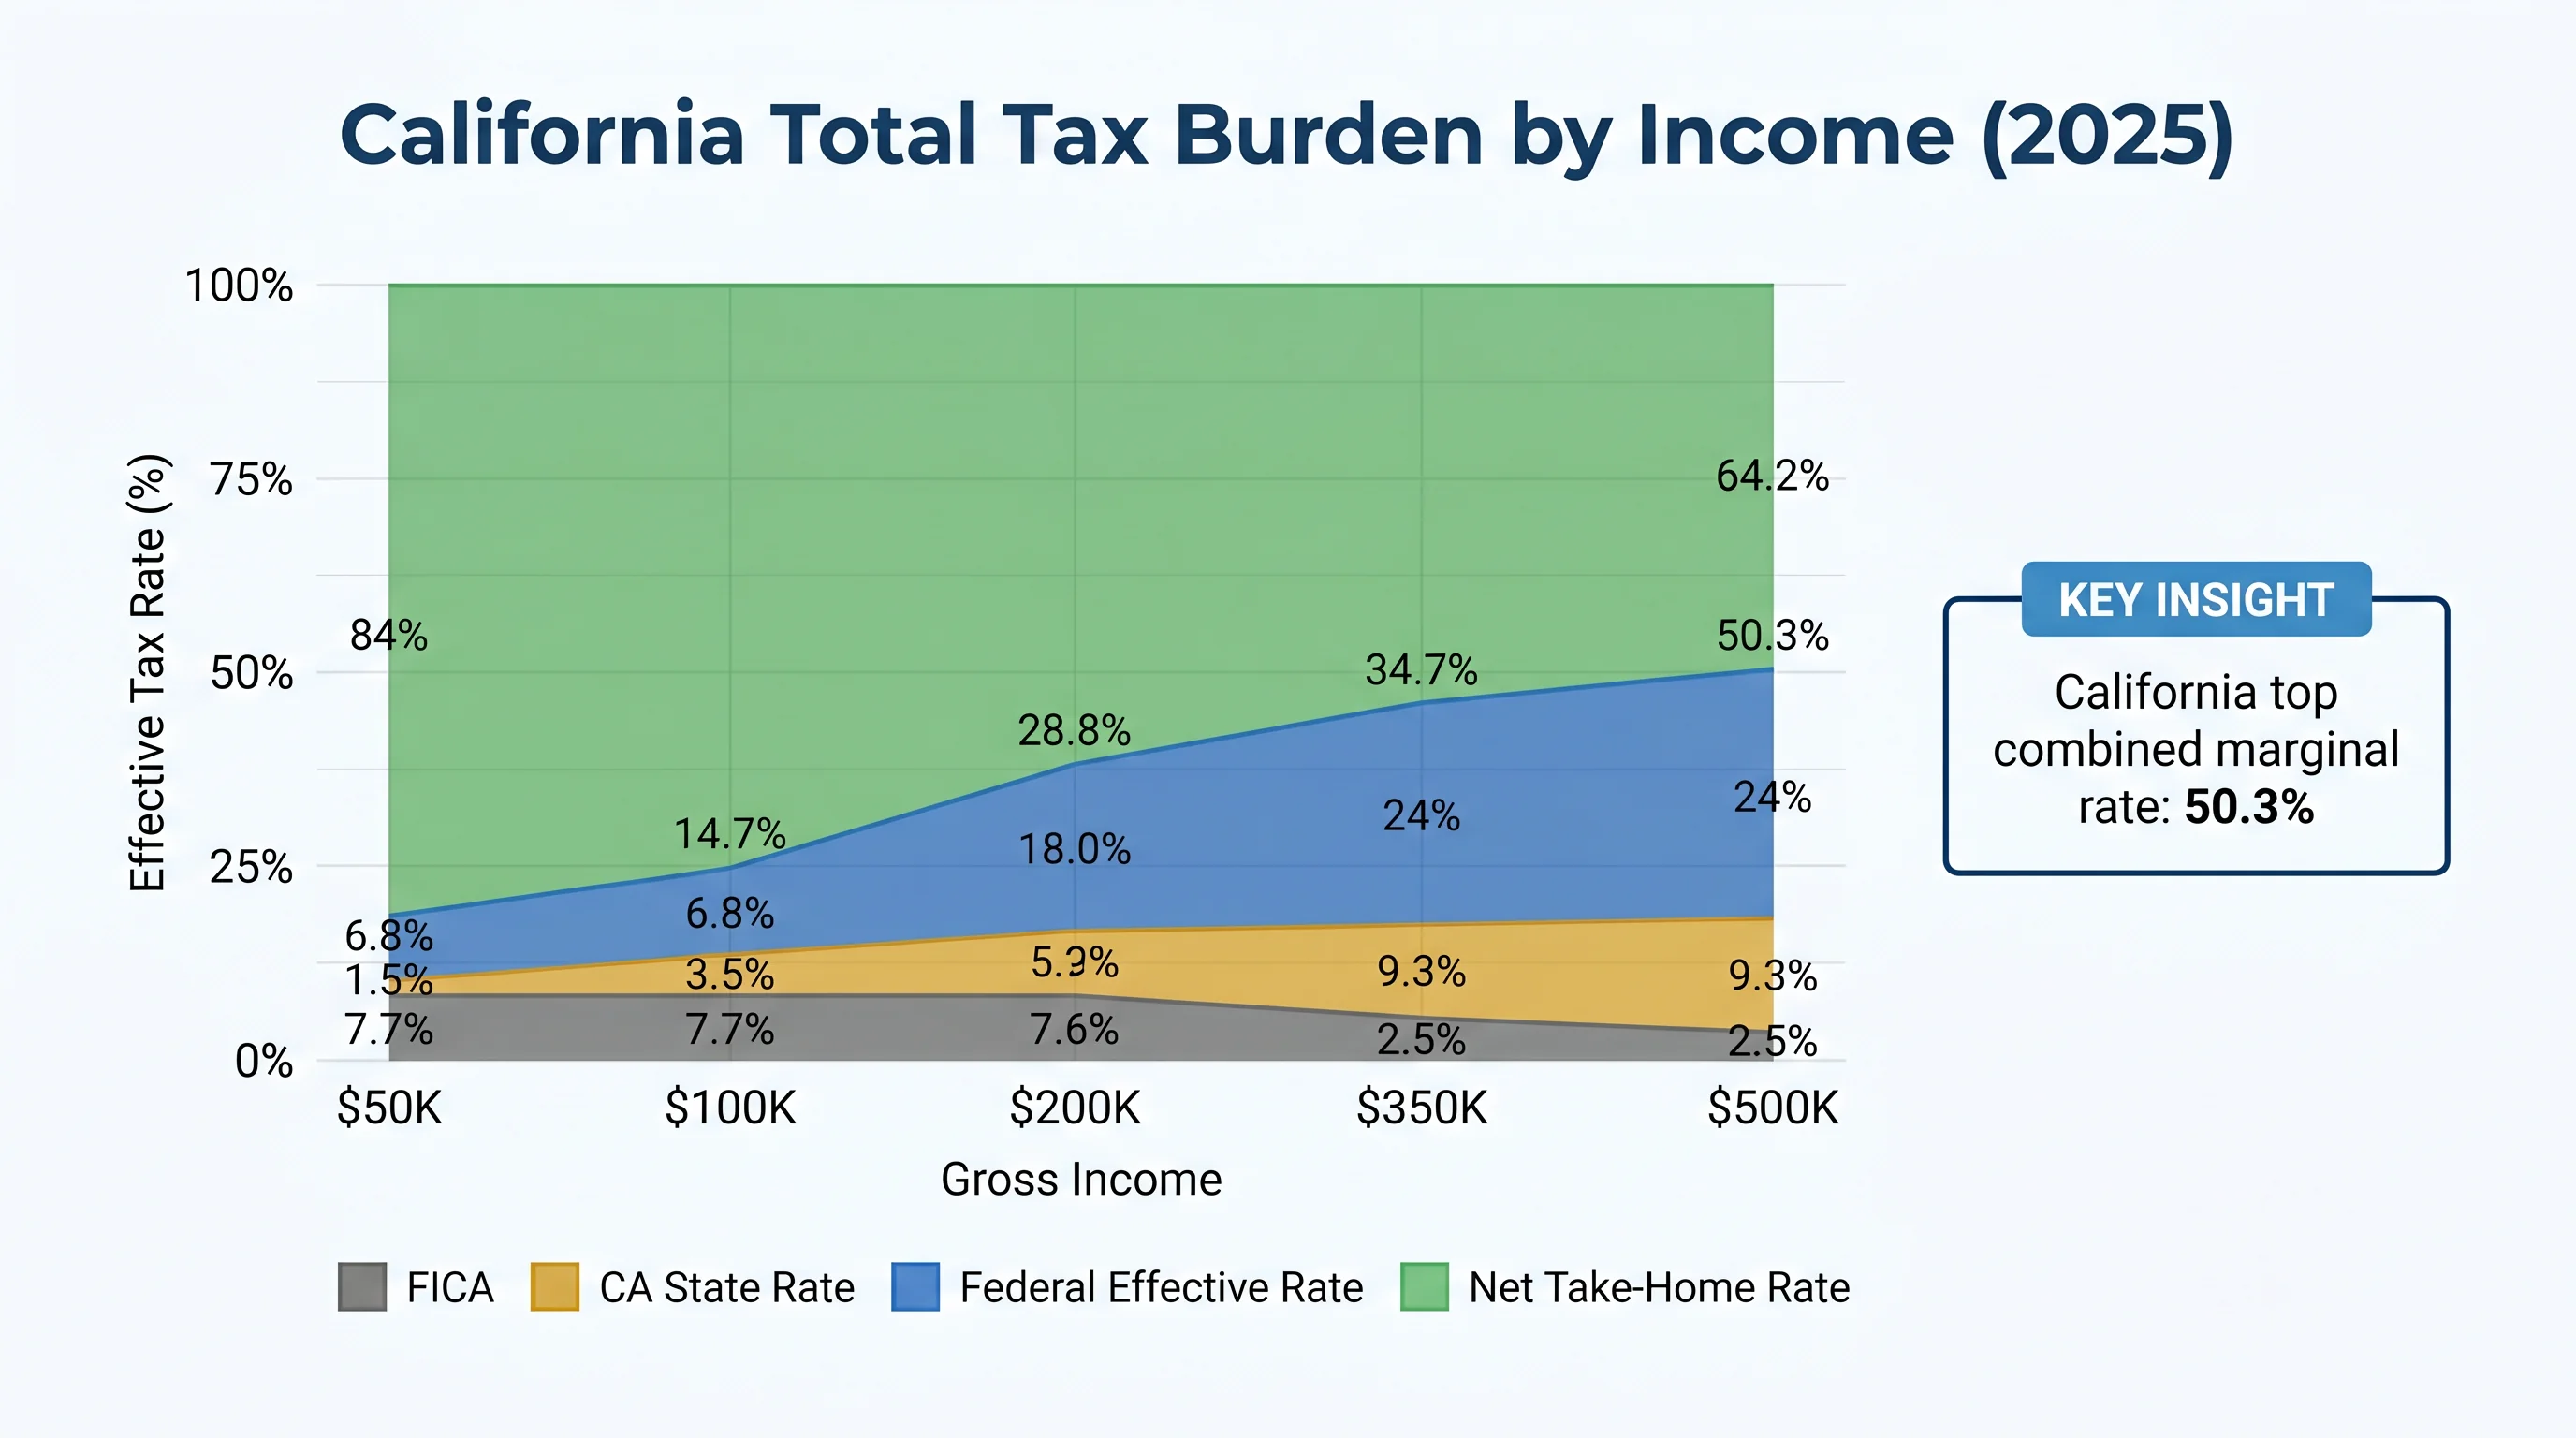
California total tax burden by income level — Illustrative. Not financial advice.
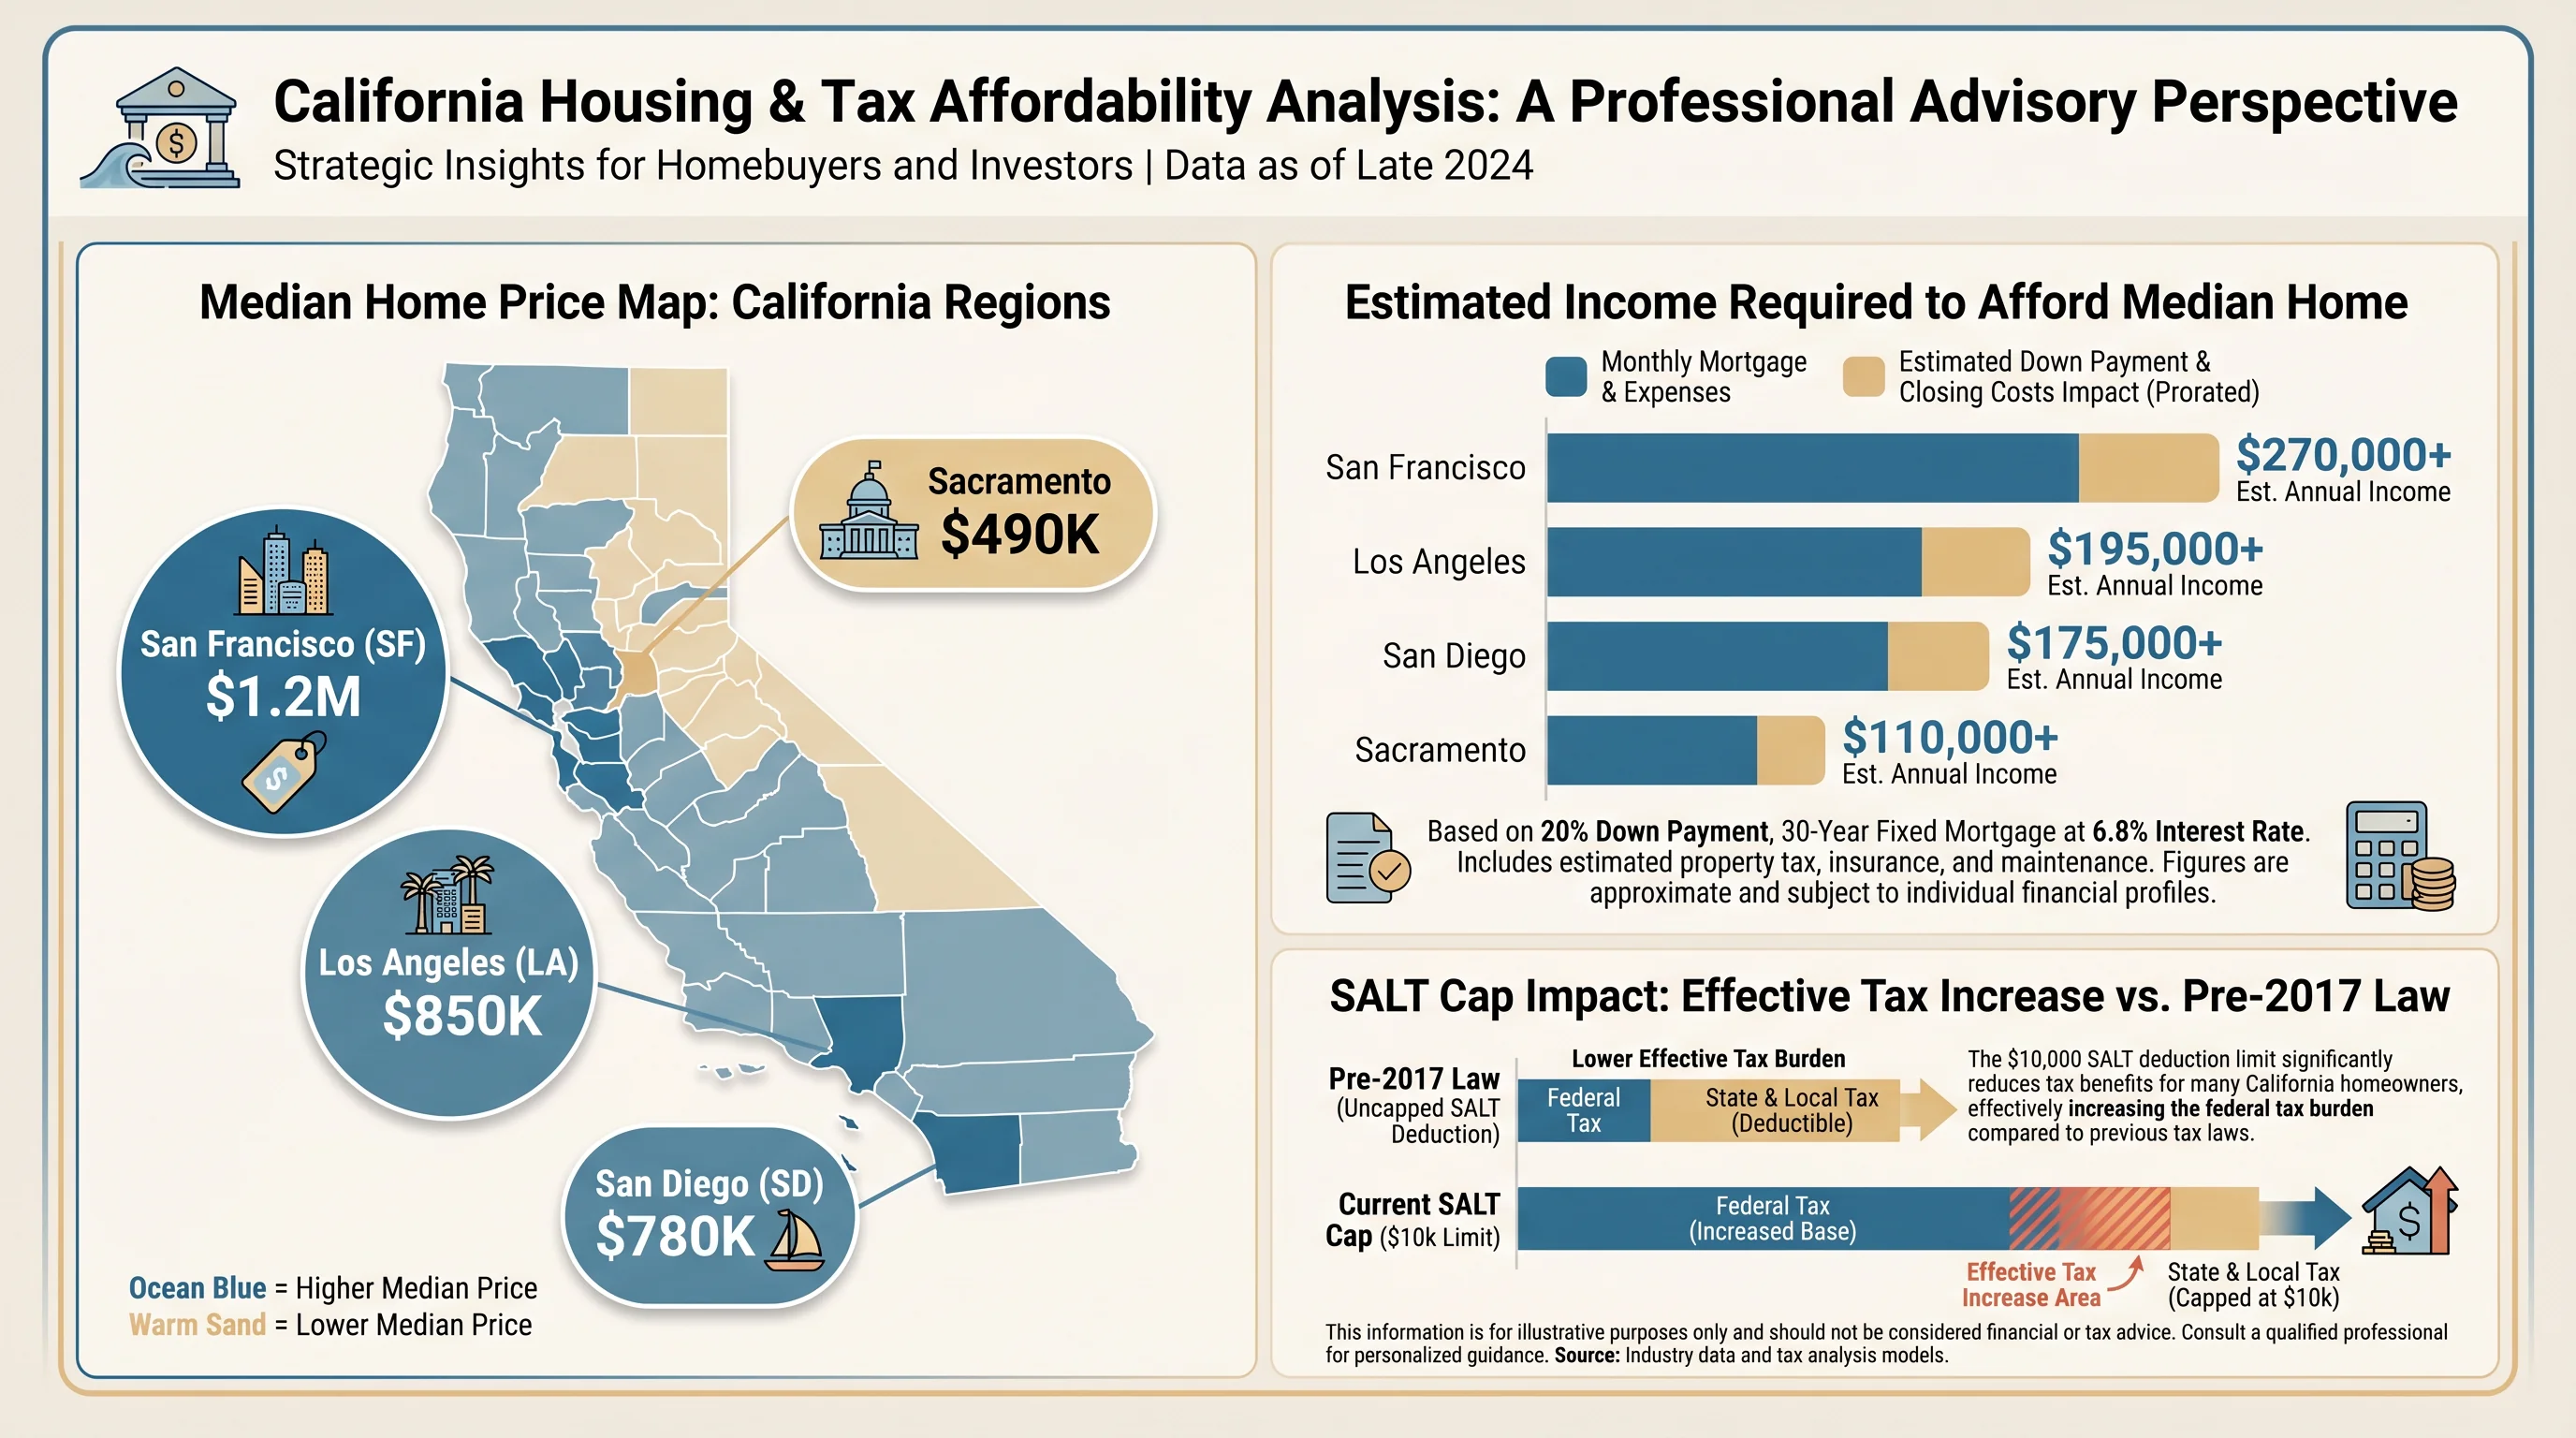
California housing affordability by region and income required — Illustrative.
What We Cover
Prop 13, Prop 19, and 1031 exchange planning for homeowners
SALT cap strategies, RDPs, and state-specific deductions
Tax-loss harvesting, muni bond allocation, CA after-tax optimization
Community property, living trusts, and multi-generational transfer
Social Security timing, RMDs, and income sequencing for CA residents
California Wealth Architecture
At $500K+ income, California professionals face one of the highest combined marginal tax rates in the developed world. Strategic income timing, account sequencing, and muni bond allocation can meaningfully reduce your lifetime tax burden.
Explore CA tax planning tools
Coverage
Built for Dual-income households optimizing taxes and benefits, Tech and media workers with equity concentration, and Pre-retirees balancing housing wealth and retirement accounts. Coverage concentrates on California retirement planning, Bay Area equity comp, and HSA California, with guides and calculators that reflect how these readers actually earn, save, and plan.
Dual-income households optimizing taxes and benefits · New CA residents
Tech and media workers with equity concentration · Small-business owners paying themselves
Pre-retirees balancing housing wealth and retirement accounts · Divorce or liquidity-event households
In practice
Pacific Wealth Desk is an independent editorial desk covering California retirement planning, Bay Area equity comp, and HSA California for Dual-income households optimizing taxes and benefits, Tech and media workers with equity concentration, and Pre-retirees balancing housing wealth and retirement accounts. California-first planning desk you can read at 10pm without being sold—tools, checklists, and optional human help when you want it. Guides state their assumptions, calculators run in your browser, and disclosures stay visible wherever regulated topics appear.
Featured tools
Free, in-browser calculators built for Dual-income households optimizing taxes and benefits, Tech and media workers with equity concentration, and Pre-retirees balancing housing wealth and retirement accounts — adjust the assumptions and stress-test the outcome before you act.
Interactive
Project how regular contributions grow over time under different return, fee, and timeline assumptions.
Future value
$1,185,264
Projected ending balance under the current compounding path.
Your contributions
$460,000
Starting capital plus every monthly contribution.
Investment growth
$725,264
The share created by compounding instead of deposits.
Output path
The line updates immediately as you change the assumptions.
Year 0 to Year 20
Interactive
Compare your current mix against a target allocation and see where drift has crept in.
Enter current and target weights. The model normalizes them to 100% and flags any sleeve that sits outside your drift band.
equities
fixed Income
alternatives
cash
Largest sleeve
55%
Anything too dominant deserves extra governance.
Effective sleeves
2.6
A lower value means the portfolio behaves like fewer real bets.
Concentration score
0.39
Herfindahl-style concentration across the current weights.
equities
Current 55% vs target 60%
Drift: -5%. Keep this sleeve within +/-5% to stay inside the current policy.
fixed Income
Current 25% vs target 20%
Drift: 5%. Keep this sleeve within +/-5% to stay inside the current policy.
alternatives
Current 10% vs target 10%
Drift: 0%. Keep this sleeve within +/-5% to stay inside the current policy.
cash
Current 10% vs target 10%
Drift: 0%. Keep this sleeve within +/-5% to stay inside the current policy.
Interactive
Model your retirement runway from savings rate, timeline, and expected returns — then stress-test it.
Nominal balance
$3M
Raw dollars at the retirement start date.
Today's dollars
$2M
Inflation-adjusted view of the same future balance.
4% rule estimate
$130K
A quick annual draw estimate before tax planning.
Output path
The line updates immediately as you change the assumptions.
42 to 65
Sustainable real income
$112K
Approximate annual spending in today's dollars if the portfolio must last through retirement.
Membership
Reader
$0
Member
$4.99/month
Optional advisory
$99 intake
FAQ
California-first planning desk you can read at 10pm without being sold—tools, checklists, and optional human help when you want it.
No. Materials are general education and illustration. Decisions involving securities, taxes, or planning should involve your own licensed professionals.
$4.99/month removes display ads for calmer reading and uninterrupted calculator sessions, and adds member features like saved scenarios as they ship. Cancel anytime.
ADV disclosures; Form CRS link set; Privacy
Household decision support with CA context baked in—not generic US boilerplate with a state badge.
Contact
Questions about a calculator or a guide? Send a note to the Pacific Wealth Desk editorial desk — we read every message. Licensing disclosures appear wherever regulated topics are discussed.
Between home equity, state taxes, and multi-account investment complexity, California professionals need more than a portfolio manager — they need a total wealth architect.
Opens fenulwealthmanagement.com, our affiliated wealth-management firm · General education only · No fiduciary relationship formed on this page